
5 best tools for data visualization - When data leads, transformation follows

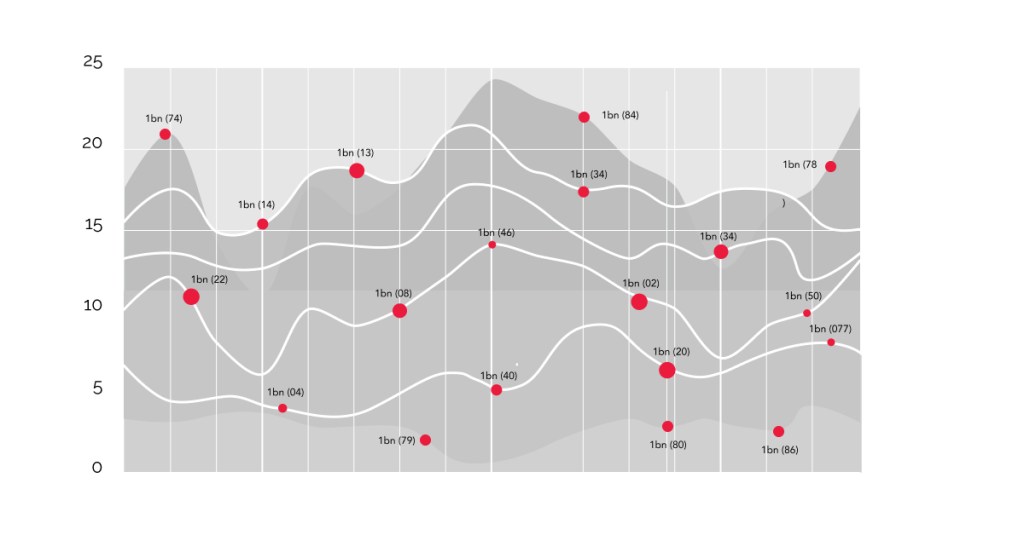
Consider the below image
And this one too
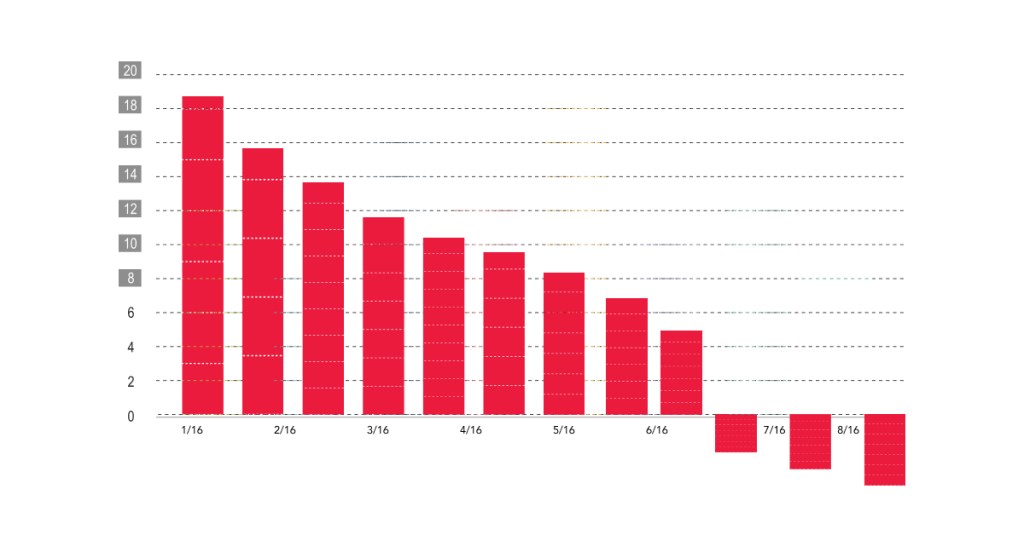
Which one looks better?
The latter one? No-brainer, isn’t it?
Why?
Because the data presented in that visualization is pretty easy to understand. You can infer a lot of information in just one go.
Data visualization is an essential aspect of data analysis. Visualization allows us to better understand complex data sets, spot trends, and identify patterns. The right data visualization tools can help organizations and individuals make data-driven decisions, gain insights, and present their findings in a way that is easily understandable. In this blog post, we’ll take a look at five of the best tools for data visualization.
Unlock the Power of Data Visualization
Improved decision-making: Quickly spot trends, outliers, and other important information, allowing you to make informed decisions.
Better communication: Easier to communicate complex data to stakeholders, making it possible to tell a story with the data.
Increased efficiency: Identify patterns in data, saving time and effort compared to manually analyzing large data sets.
Enhanced understanding of data: Reveal hidden insights in data that might not be obvious from looking at raw data alone.
Better collaboration: Collaborate with employees, customers, or suppliers, and share information in an accessible and understandable way.
Let us understand each tool in detail:
- Tableau
Tableau is a data visualization tool that has been a market leader for many years. It enables users to interact with and analyze large amounts of data. It operates by connecting to data sources and then allowing users to manipulate the data. It presents data in the form of charts, graphs, and other visualizations to help make sense of the data.
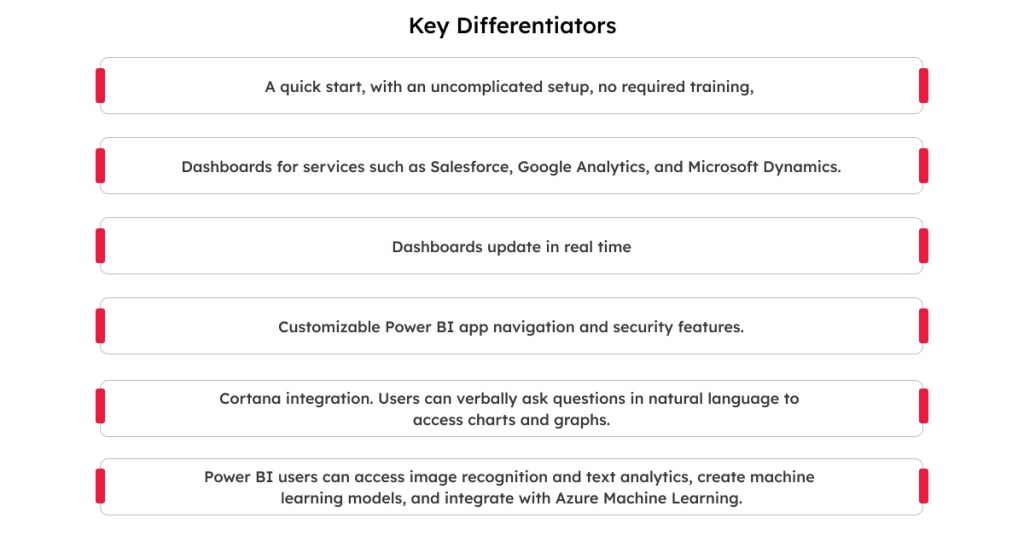
- Microsoft Power BI
Another popular tool, Microsoft Power BI wants to create a data-driven business intelligence culture in all companies. It offers self-service analytics tools that can be used to analyze, aggregate, and share data. It provides hundreds of data visualizations to its customers along with built-in Artificial Intelligence capabilities and Excel integration facilities.
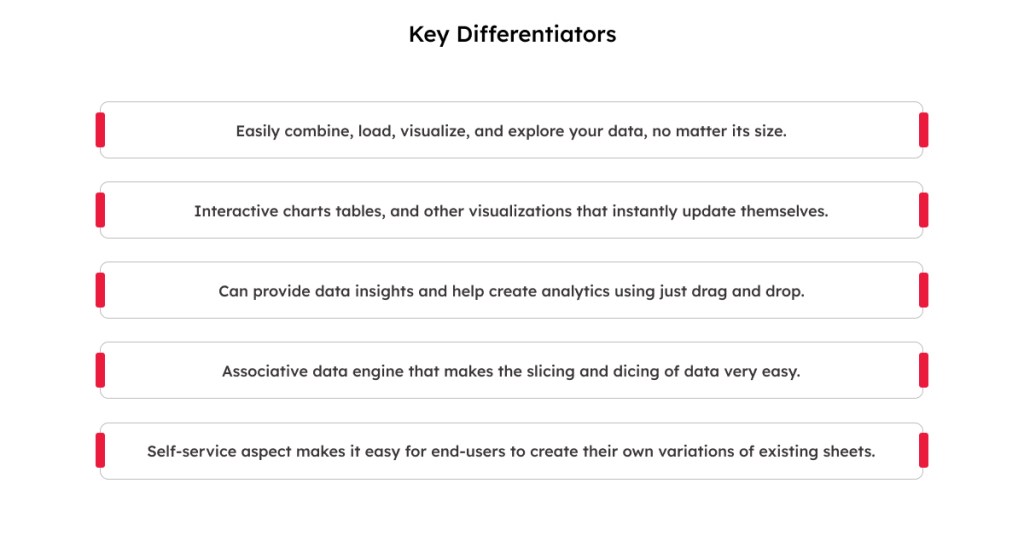
- Qlik Sense
Qlik Sense is a revolutionary application allowing self-service data visualization and data discovery for individuals, teams and companies. It runs on the cloud, making it faster and easier to set up. With Qlik, things like data prep and app development are done via the web, so there’s no need to download or maintain tools.
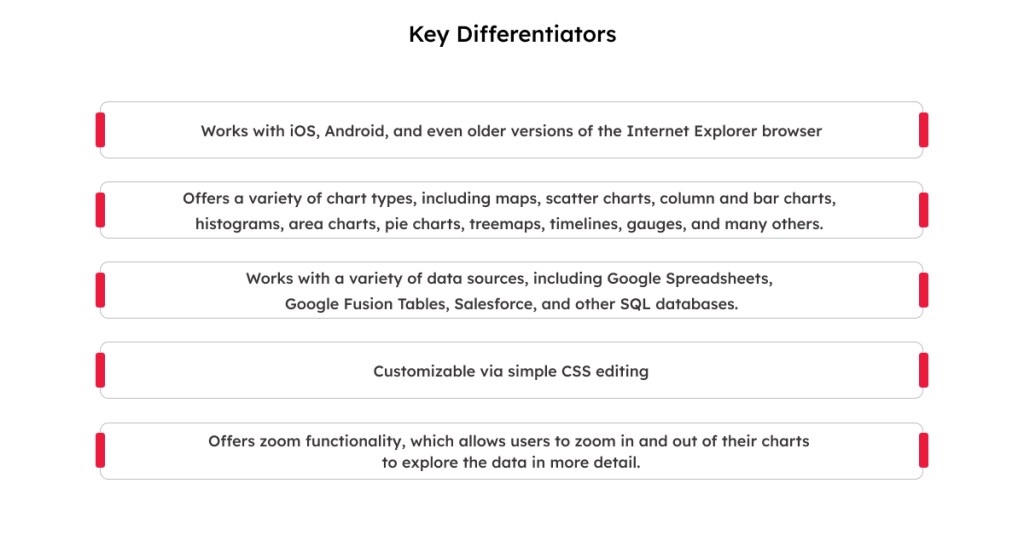
- Google Charts
One of the major players in the data visualization market space, Google Charts, coded with SVG and HTML5. It’s not as feature-rich as some of its competitors, but Google Charts is free forever. It’s a web-based data visualization tool that is designed to be easy to use and can be embedded into web pages and applications.
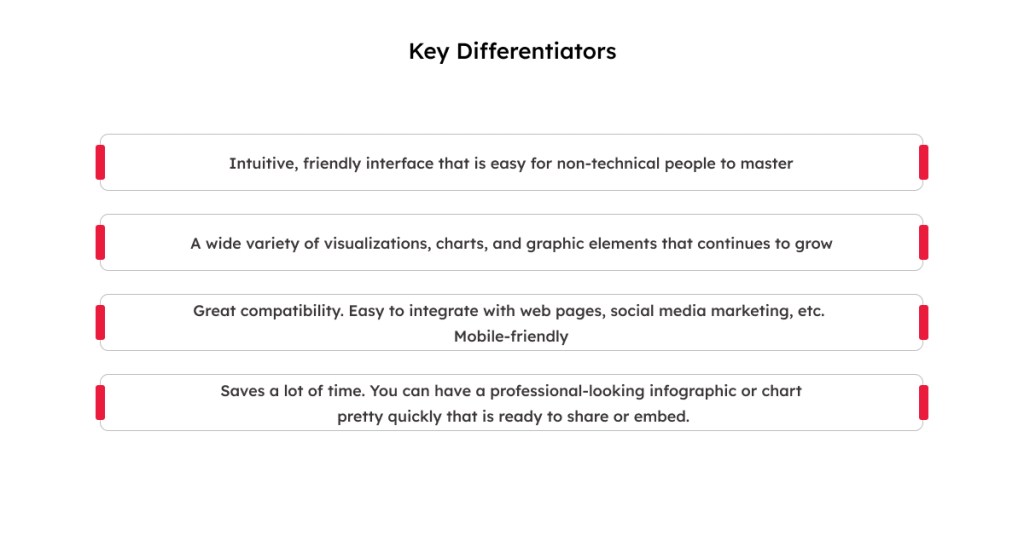
- Infogram
Infogram provides customers with over 550 maps and 35 charts, 20 ready-made design templates, numerous pictures and icons, a drag-and-drop editor, and other features. It has a database of over a million icons, GIFs, and photos. When the aesthetics of your visualizations is a key aspect of your presentation, Infogram is the tool to choose.
Data visualization is an integral part of modern businesses and decision-making processes. Each of these tools has its own unique strengths and capabilities, making them well-suited for different use cases and business needs.
When selecting a data visualization tool, it’s essential to consider the type of data you have, the volume of data, and the goals of your business. We hope this blog post has helped you in making an informed decision.
Remember, choosing the right tool can help you turn insights into action. So, select the tool that best meets your business requirements and start creating visually stunning data presentations today!

Related content
Web3 and Blockchain
Tailored Web3 and blockchain solutions to help companies meet business objectives with scalability and insights.
Data Engineering
Empower your business with data-driven decision-making through our insightful data engineering solutions.
Mendix
We leverage Mendix's low-code platform to deliver customizable agile solutions that perfectly match your needs.


Stay up to date with InfoBeans
Insights from our team of experts who deliver digital software day in and day out.
![]() Thank you for signing up!
Thank you for signing up!
![]() Thanks a lot for your interest. You are already a subscriber. You will receive your first newsletter soon.
Thanks a lot for your interest. You are already a subscriber. You will receive your first newsletter soon.