
Three ways Experiment Dashboards help you build better products

Big Tech’s market cap is crumbling. Startup valuations are dropping rapidly. Companies need to be smarter and invest their resources where they can deliver maximum impact. Organizations more than ever need to be able to track decisions and learnings so institutional knowledge isn’t lost as team members come and go (hello great resignation). A standard place to share can help deliver accelerated product growth and innovation.
What is an Experiment Dashboard
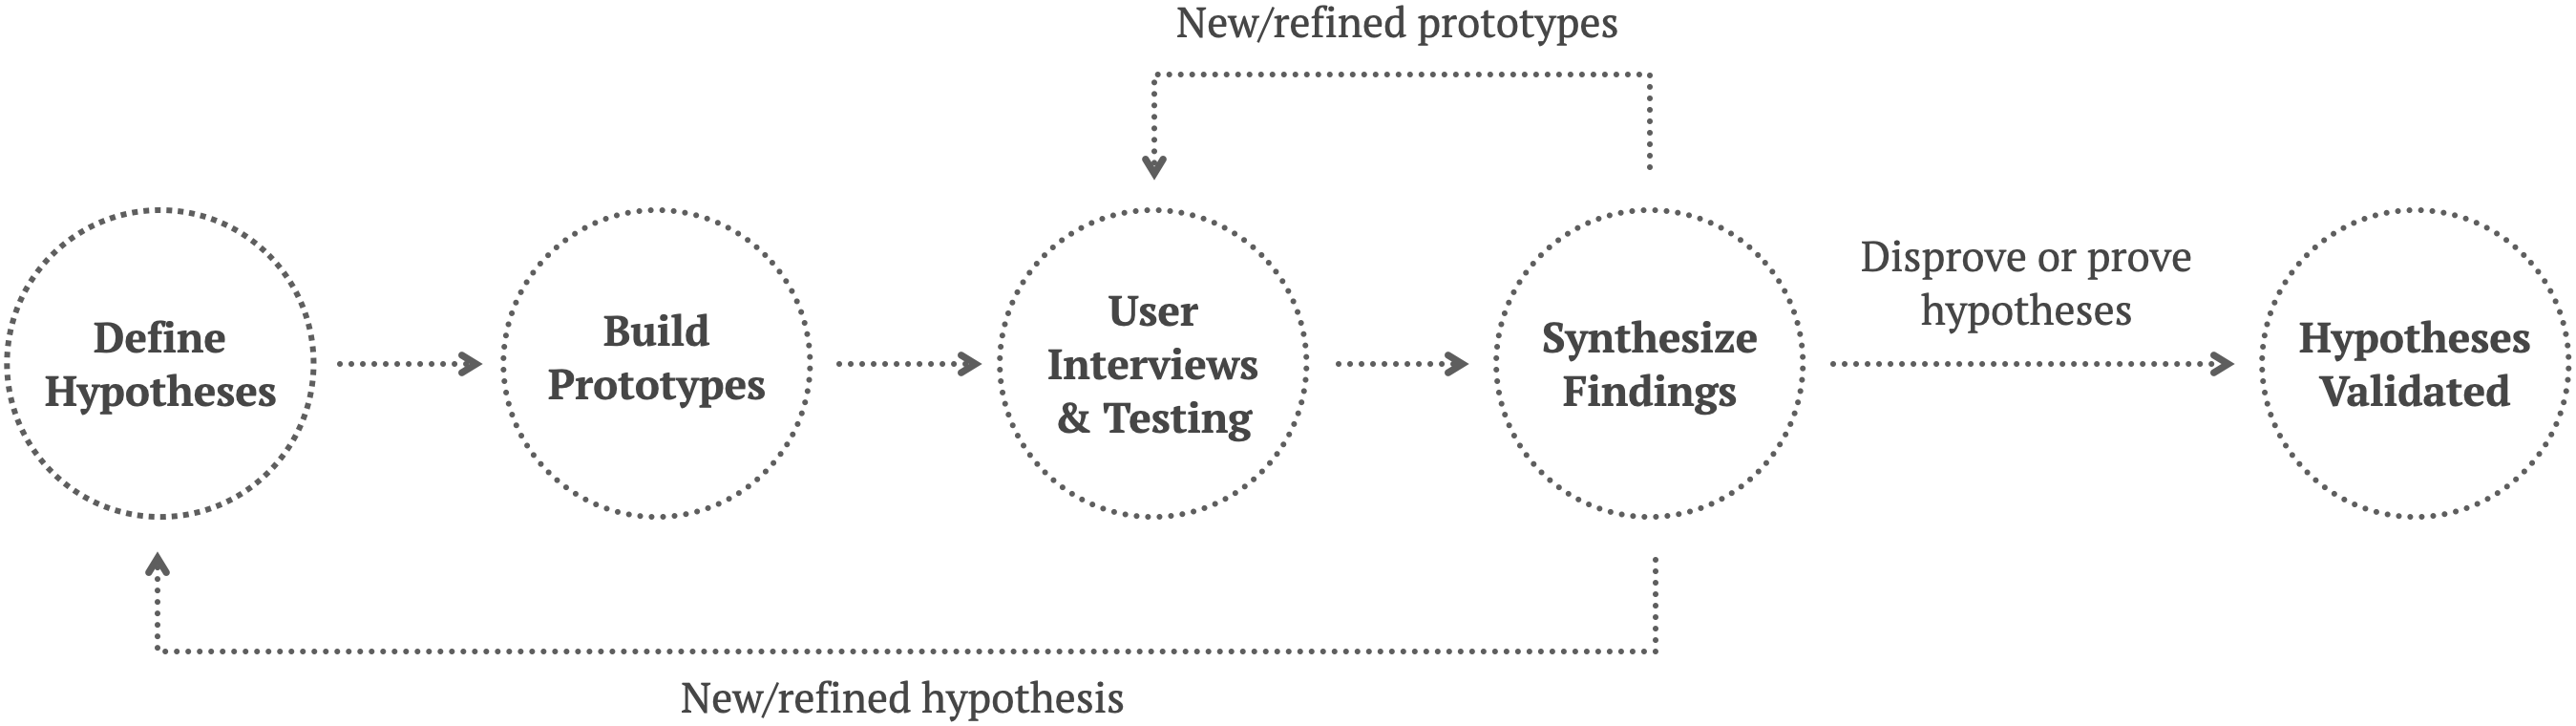
In Experiment Driven Design we break down big ideas into smaller testable experiments. The length of an experiment may vary, but what does not vary is that we track everything in a single source of truth: an Experiment Dashboard. Our Experiment Dashboards typically live in a spreadsheet (or AirTable). They include at a minimum: a prioritized list of our hypotheses with any key learnings; and a prioritized list of experiments that tie back to our hypotheses with goals. They may also include other things such as a dashboard overview of research to date; a list of test participants; a list of prototypes, etc
You can read more about them in our post How to Build and Maintain an Experiment Dashboard
One: Smarter Decisions
Experiment Dashboards frame our digital product work around learning. They highlight what assumptions we believe to be true in the form of hypotheses. These dashboards encourage teams to try smaller experiments before over investing in the building. By explicitly stating what we believe to be true versus what we know to be true it helps us be smarter with how we prioritize our time.
For example, we worked with a major media company to improve data collection and privacy. We had many hypotheses going into this project. One of the first hypotheses we had was “If we educate users, then more users will share data.” We had different concepts for how this could come to life. An early concept we prototyped included one of their biggest stars filming a fun educational segment on data collection and why it was important for the company and users. Another one gave people short but quick insights into different types of data and why they mattered.
Instead of actually producing a video, we just used a doctored screenshot in our prototype to learn. One of the fascinating things we found in one of our early experiments was that information could build trust, but also could easily overwhelm users. And didn’t increase the number of opt-ins. Learning about this hypothesis early on in the project saved us a tremendous amount of time. And it saved the business investment in content and features that would not drive towards the intended business outcomes.
Tracking these learnings in our Experiment Dashboard meant that it was front and center and we could always reference other teams back to it.
Two: Learnings help you stay in front of your competition
Experimental innovators like Chris Rock, Brin, and Page, Jeff Bezos, and Beethoven don’t analyze new ideas too much, too soon, or put their hopes into one big bet.” – Peter Sims, Little Bets
Great companies stay ahead of their competition. Innovation requires learning and experimentation. You can always build a copycat product. A company like Snapchat can thrive despite much bigger companies like Meta ripping off their product innovations (ie stories and vertical photos) because of the learnings that they uncover while being live ahead of their competition. The data from analytics and qualitative learnings from user interviews power you past your competition.
With that same major media company, we looked at how we could build upon our learnings from data privacy to another valuable area of the business. Collecting this data could have a multi-billion dollar impact on their bottom line. Their competition was watching their data privacy features. Their competitors could only see the end results. They didn’t know the other insights such as the negative effects of over educating users or interrupting a user’s flow.
Instead, we were able to leverage those previous learnings in future experiments so our work stayed ahead of our competition. And as new teams and departments were introduced to our work, we had documented a clear set of learnings to reference. Stakeholders across, up and down the organization knew that the decisions we made were backed up with data.
Three: A source of truth across functions
Enterprises are almost always silo’d. Product teams have to make many, many decisions on a given project every single day. Many times these decisions are not clearly documented and the WHY behind them is lost.
Experiment Dashboards become a key source of truth for why decisions are made. And they can easily be shared across departments in a format that is comfortable (and fast) for executives to scan.
Working with one of the world’s largest Credit Card companies we created an experiment dashboard in Excel. This became our source of truth as we were learning from our different experiments. Like most of our projects, the main stakeholder funding the project was not involved in the day to day. Every week he received a read out with the experiment dashboard spreadsheet so he could easily see our learnings. Plus he could then share those learnings with other leaders who would be required to make the project a success once we got past the initial learning phase.
——-
Experiment dashboards help you build smarter. Better. And Faster. They help you share across departments and stay ahead of your competition. We hope you try using it on your next project. Feel free to get in touch with any questions.

Related content
Data Engineering
Empower your business with data-driven decision-making through our insightful data engineering solutions.
SLA-based Managed Services
We proactively monitor endpoints and keep systems up-to-date, preventing issues and ensuring optimal performance.
Performance Management & Monitoring
We improve product performance by enhancing features, optimizing platforms and polishing the design & architecture.


Stay up to date with InfoBeans
Insights from our team of experts who deliver digital software day in and day out.
![]() Thank you for signing up!
Thank you for signing up!
![]() Thanks a lot for your interest. You are already a subscriber. You will receive your first newsletter soon.
Thanks a lot for your interest. You are already a subscriber. You will receive your first newsletter soon.